Contents
Key Stage 2
Meaning
A Bar Chart is a type of graph used to compare data.
About Bar Charts
- Bar Charts are used when you are comparing two or more numbers in a category.
- The category you choose should go on the bottom of the bar chart.
- What you count or measure should go up the side of the bar chart
- The bars in a bar chart should not be touching.
Examples
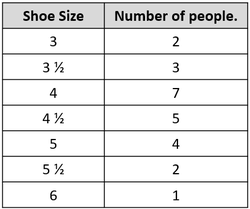
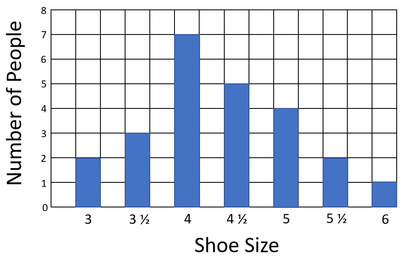
| Results table for the bar chart. | A bar chart comparing the numbers of people with each shoe size in a class. |
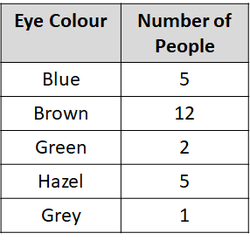
| Results table for the bar chart. | A bar chart comparing the numbers of people with different eye colour in a class. |
Key Stage 3
Meaning
A Bar Chart is a type of graph used to compare categoric variables.
About Bar Charts
- Bar Charts are used when you are comparing two or more numbers in a category.
- The category is the independent variable in an investigation.
- The dependent variable is a number in the category.
- The categoric variable goes on the x-axis of a bar chart.
- The number counted or measured should go on the y-axis of the bar chart
- The bars in a bar chart should not be touching.
Key Stage 4
Meaning
A Bar Chart is a type of graph used to compare categoric variables.
About Bar Charts
- Bar Charts are used when you are comparing two or more numbers in a category.
- The category is the independent variable in an investigation.
- The dependent variable is a number in the category.
- The categoric variable goes on the x-axis of a bar chart.
- The number counted or measured should go on the y-axis of the bar chart
- The bars in a bar chart should not be touching.
References
AQA
- Bar chart, pages 40-1, GCSE Physics; Student Book, Collins, AQA
- Bar charts, page 15, GCSE Combined Science Trilogy; Physics, CGP, AQA
- Bar charts, page 16, GCSE Biology, CGP, AQA
- Bar charts, page 16, GCSE Chemistry, CGP, AQA
- Bar charts, page 16, GCSE Combined Science Trilogy; Biology, CGP, AQA
- Bar charts, page 16, GCSE Combined Science Trilogy; Chemistry, CGP, AQA
- Bar charts, page 16, GCSE Physics; The Complete 9-1 Course for AQA, CGP, AQA
- Bar charts, page 268, GCSE Chemistry; Third Edition, Oxford University Press, AQA
- Bar charts, page 6, GCSE Biology; The Revision Guide, CGP, AQA
- Bar charts, page 6, GCSE Combined Science; The Revision Guide, CGP, AQA
- Bar charts, page 7, GCSE Chemistry; The Revision Guide, CGP, AQA
- Bar charts, pages 260-261, 281, GCSE Physics; Third Edition, Oxford University Press, AQA
- Bar graphs, pages 56, GCSE Combined Science Trilogy 2, Hodder, AQA


