Difference between revisions of "Bar Chart"
(→References) |
|||
| Line 62: | Line 62: | ||
:[https://www.amazon.co.uk/gp/product/019835939X/ref=as_li_tl?ie=UTF8&camp=1634&creative=6738&creativeASIN=019835939X&linkCode=as2&tag=nrjc-21&linkId=57e96876985fc39b1a3d8a3e3dc238b6 ''Bar charts, pages 260-261, 281, GCSE Physics; Third Edition, Oxford University Press, AQA ''] | :[https://www.amazon.co.uk/gp/product/019835939X/ref=as_li_tl?ie=UTF8&camp=1634&creative=6738&creativeASIN=019835939X&linkCode=as2&tag=nrjc-21&linkId=57e96876985fc39b1a3d8a3e3dc238b6 ''Bar charts, pages 260-261, 281, GCSE Physics; Third Edition, Oxford University Press, AQA ''] | ||
:[https://www.amazon.co.uk/gp/product/1471851362/ref=as_li_tl?ie=UTF8&camp=1634&creative=6738&creativeASIN=1471851362&linkCode=as2&tag=nrjc-21&linkId=7d78d70a2044ee9982dae010c94af92a ''Bar graphs, pages 56, GCSE Combined Science Trilogy 2, Hodder, AQA ''] | :[https://www.amazon.co.uk/gp/product/1471851362/ref=as_li_tl?ie=UTF8&camp=1634&creative=6738&creativeASIN=1471851362&linkCode=as2&tag=nrjc-21&linkId=7d78d70a2044ee9982dae010c94af92a ''Bar graphs, pages 56, GCSE Combined Science Trilogy 2, Hodder, AQA ''] | ||
| + | ====Edexcel==== | ||
| + | :[https://www.amazon.co.uk/gp/product/1782948120/ref=as_li_tl?ie=UTF8&camp=1634&creative=6738&creativeASIN=1782948120&linkCode=as2&tag=nrjc-21&linkId=dedef775c6a43dbb0a609441525adac0 ''Bar charts, page 16, GCSE Biology, CGP, Edexcel ''] | ||
| + | :[https://www.amazon.co.uk/gp/product/1782948147/ref=as_li_tl?ie=UTF8&camp=1634&creative=6738&creativeASIN=1782948147&linkCode=as2&tag=nrjc-21&linkId=f63dcd8345f4e49c717b39a228a36c7c ''Bar charts, page 16, GCSE Chemistry, CGP, Edexcel ''] | ||
| + | :[https://www.amazon.co.uk/gp/product/1782948163/ref=as_li_tl?ie=UTF8&camp=1634&creative=6738&creativeASIN=1782948163&linkCode=as2&tag=nrjc-21&linkId=0fdbfd5dd397d6e24a9dfb250f08587f ''Bar charts, page 16, GCSE Physics, CGP, Edexcel ''] | ||
| + | :[https://www.amazon.co.uk/gp/product/1782945741/ref=as_li_tl?ie=UTF8&camp=1634&creative=6738&creativeASIN=1782945741&linkCode=as2&tag=nrjc-21&linkId=30da4f2178da182547b62a7329d13b57 ''Bar charts, page 6, GCSE Combined Science; The Revision Guide, CGP, Edexcel ''] | ||
| + | :[https://www.amazon.co.uk/gp/product/1782946748/ref=as_li_tl?ie=UTF8&camp=1634&creative=6738&creativeASIN=1782946748&linkCode=as2&tag=nrjc-21&linkId=a4f0348fc37d0ba1bb52d27f8679581f ''Bar charts, page 7, GCSE Biology; The Revision Guide, CGP, Edexcel ''] | ||
| + | :[https://www.amazon.co.uk/gp/product/1782945725/ref=as_li_tl?ie=UTF8&camp=1634&creative=6738&creativeASIN=1782945725&linkCode=as2&tag=nrjc-21&linkId=694be7494de75af3349537d34e13f7f0 ''Bar charts, page 7, GCSE Chemistry; The Revision Guide, CGP, Edexcel ''] | ||
| + | :[https://www.amazon.co.uk/gp/product/1782945733/ref=as_li_tl?ie=UTF8&camp=1634&creative=6738&creativeASIN=1782945733&linkCode=as2&tag=nrjc-21&linkId=2a2dbec9db6bf5766c0458d908fa0a52 ''Bar charts, page 7, GCSE Physics; The Revision Guide, CGP, Edexcel ''] | ||
Revision as of 14:14, 2 November 2019
Contents
Key Stage 2
Meaning
A Bar Chart is a type of graph used to compare data.
About Bar Charts
- Bar Charts are used when you are comparing two or more numbers in a category.
- The category you choose should go on the bottom of the bar chart.
- What you count or measure should go up the side of the bar chart
- The bars in a bar chart should not be touching.
Examples
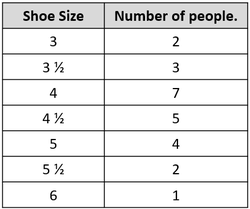
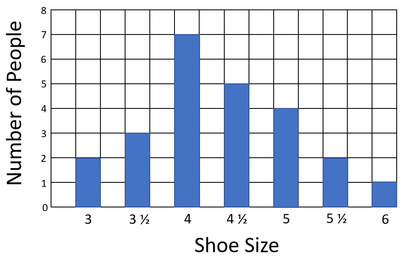
| Results table for the bar chart. | A bar chart comparing the numbers of people with each shoe size in a class. |
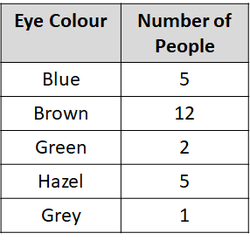
| Results table for the bar chart. | A bar chart comparing the numbers of people with different eye colour in a class. |
Key Stage 3
Meaning
A Bar Chart is a type of graph used to compare categoric variables.
About Bar Charts
- Bar Charts are used when you are comparing two or more numbers in a category.
- The category is the independent variable in an investigation.
- The dependent variable is a number in the category.
- The categoric variable goes on the x-axis of a bar chart.
- The number counted or measured should go on the y-axis of the bar chart
- The bars in a bar chart should not be touching.
Key Stage 4
Meaning
A Bar Chart is a type of graph used to compare categoric variables.
About Bar Charts
- Bar Charts are used when you are comparing two or more numbers in a category.
- The category is the independent variable in an investigation.
- The dependent variable is a number in the category.
- The categoric variable goes on the x-axis of a bar chart.
- The number counted or measured should go on the y-axis of the bar chart
- The bars in a bar chart should not be touching.
References
AQA
- Bar chart, pages 40-1, GCSE Physics; Student Book, Collins, AQA
- Bar charts, page 15, GCSE Combined Science Trilogy; Physics, CGP, AQA
- Bar charts, page 16, GCSE Biology, CGP, AQA
- Bar charts, page 16, GCSE Chemistry, CGP, AQA
- Bar charts, page 16, GCSE Combined Science Trilogy; Biology, CGP, AQA
- Bar charts, page 16, GCSE Combined Science Trilogy; Chemistry, CGP, AQA
- Bar charts, page 16, GCSE Physics; The Complete 9-1 Course for AQA, CGP, AQA
- Bar charts, page 268, GCSE Chemistry; Third Edition, Oxford University Press, AQA
- Bar charts, page 6, GCSE Biology; The Revision Guide, CGP, AQA
- Bar charts, page 6, GCSE Combined Science; The Revision Guide, CGP, AQA
- Bar charts, page 7, GCSE Chemistry; The Revision Guide, CGP, AQA
- Bar charts, pages 260-261, 281, GCSE Physics; Third Edition, Oxford University Press, AQA
- Bar graphs, pages 56, GCSE Combined Science Trilogy 2, Hodder, AQA
Edexcel
- Bar charts, page 16, GCSE Biology, CGP, Edexcel
- Bar charts, page 16, GCSE Chemistry, CGP, Edexcel
- Bar charts, page 16, GCSE Physics, CGP, Edexcel
- Bar charts, page 6, GCSE Combined Science; The Revision Guide, CGP, Edexcel
- Bar charts, page 7, GCSE Biology; The Revision Guide, CGP, Edexcel
- Bar charts, page 7, GCSE Chemistry; The Revision Guide, CGP, Edexcel
- Bar charts, page 7, GCSE Physics; The Revision Guide, CGP, Edexcel


