Difference between revisions of "Distance-Time Graph"
(→About Distance Time Graphs) |
(→About Distance Time Graphs) |
||
| Line 8: | Line 8: | ||
{| class="wikitable" | {| class="wikitable" | ||
|- | |- | ||
| − | | style="height:20px; width:200px; text-align:center;" | | + | | style="height:20px; width:200px; text-align:center;" |'''Slow Speed''' |
| − | | style="height:20px; width:200px; text-align:center;" | | + | | style="height:20px; width:200px; text-align:center;" |'''Medium Speed''' |
| − | | style="height:20px; width:200px; text-align:center;" | | + | | style="height:20px; width:200px; text-align:center;" |'''High Speed''' |
|- | |- | ||
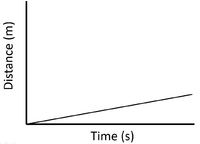
|[[File:dtGraphSlowSpeed.png|center|200px]] | |[[File:dtGraphSlowSpeed.png|center|200px]] | ||
| Line 16: | Line 16: | ||
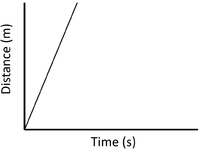
|[[File:dtGraphHighSpeed.png|center|200px]] | |[[File:dtGraphHighSpeed.png|center|200px]] | ||
|- | |- | ||
| − | | style="height:20px; width:200px; text-align:center;" | | + | | style="height:20px; width:200px; text-align:center;" |'''Stationary''' |
| − | | style="height:20px; width:200px; text-align:center;" | | + | | style="height:20px; width:200px; text-align:center;" |'''Accelerating''' |
| − | | style="height:20px; width:200px; text-align:center;" | | + | | style="height:20px; width:200px; text-align:center;" |'''Decelerating''' |
|- | |- | ||
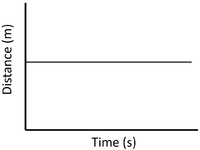
|[[File:dtGraphStationary.png|center|200px]] | |[[File:dtGraphStationary.png|center|200px]] | ||
Revision as of 08:03, 13 October 2018
Key Stage 3
Meaning
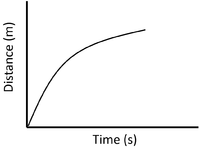
A distance time graph is a graph that shows how the distance of an object from the origin changes with time.
About Distance Time Graphs
- Distance-time graphs give information about the journey taken by an object.
- A distance time graph can show the speed of an object.
| Slow Speed | Medium Speed | High Speed |
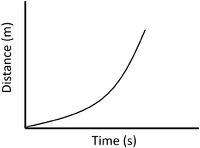
| Stationary | Accelerating | Decelerating |
