Difference between revisions of "GCSE Biology Required Practical: Osmosis in Plant Tissue"
(→Method) |
|||
| (4 intermediate revisions by the same user not shown) | |||
| Line 1: | Line 1: | ||
==Key Stage 4== | ==Key Stage 4== | ||
| + | {{#ev:youtube|https://www.youtube.com/watch?v=oieXYuQm_xE}} | ||
===Meaning=== | ===Meaning=== | ||
Investigate the effect of the [[concentration]] of [[sugar]] [[solution]] on the [[mass]] of [[plant]] [[tissue]]. | Investigate the effect of the [[concentration]] of [[sugar]] [[solution]] on the [[mass]] of [[plant]] [[tissue]]. | ||
| Line 23: | Line 24: | ||
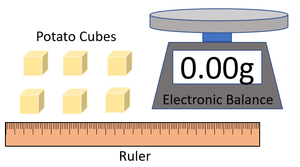
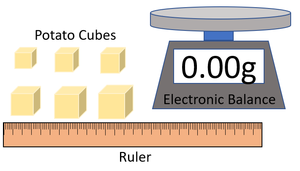
:1. Cut 6 equal volumes of plant tissue (potato). | :1. Cut 6 equal volumes of plant tissue (potato). | ||
:2. Dry the plant tissue with paper towel and [[measure]] the [[mass]] of each piece using an [[Electronic Balance|electronic balance]] or find their [[Volume (Space)|volume]] by [[measuring]] length, width and height with [[ruler]] and multiplying them together. | :2. Dry the plant tissue with paper towel and [[measure]] the [[mass]] of each piece using an [[Electronic Balance|electronic balance]] or find their [[Volume (Space)|volume]] by [[measuring]] length, width and height with [[ruler]] and multiplying them together. | ||
| − | | style="height:20px; width:200px; text-align:center;" |:3. Use a [[Measuring Cylinder]] to measure 10cm<sup>3</sup> of 1.0M [[sugar]] [[solution]] and pour it into a [[Boiling Tube]]. | + | | style="height:20px; width:200px; text-align:center;" | |
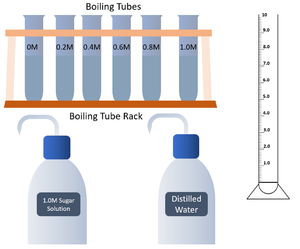
| + | :3. Use a [[Measuring Cylinder]] to measure 10cm<sup>3</sup> of 1.0M [[sugar]] [[solution]] and pour it into a [[Boiling Tube]]. | ||
:4. Repeat step 3 with 8cm<sup>3</sup> of [[sugar]] [[solution]] and 2cm<sup>3</sup> of distilled water to give 0.8M [[sugar]] [[solution]], then 6cm<sup>3</sup> and 4cm<sup>3</sup> of distilled water to give 0.6M [[sugar]] [[solution]], repeating this pattern until there is 10cm<sup>3</sup> of 0.0M [[sugar]] [[solution]]. | :4. Repeat step 3 with 8cm<sup>3</sup> of [[sugar]] [[solution]] and 2cm<sup>3</sup> of distilled water to give 0.8M [[sugar]] [[solution]], then 6cm<sup>3</sup> and 4cm<sup>3</sup> of distilled water to give 0.6M [[sugar]] [[solution]], repeating this pattern until there is 10cm<sup>3</sup> of 0.0M [[sugar]] [[solution]]. | ||
|} | |} | ||
{| class="wikitable" | {| class="wikitable" | ||
|- | |- | ||
| − | |[[File:OsmosisPractical4.png|center| | + | |[[File:OsmosisPractical4.png|center|300px]] |
| − | |[[File:OsmosisPractical5.png|center| | + | |[[File:OsmosisPractical5.png|center|300px]] |
|- | |- | ||
| − | | style="height:20px; width:200px; text-align:center;" |:5. Place one piece of plant tissue into each of the 6 [[Boiling Tube|boiling tubes]] leaving them for 12-24 hours (ensuring it is the same time for all). | + | | style="height:20px; width:200px; text-align:center;" | |
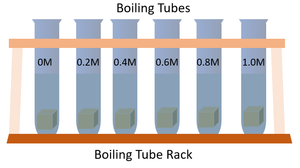
| − | | style="height:20px; width:200px; text-align:center;" |:6. Remove the pieces of plant tissue, drying them with a paper towel and measure their [[mass]]. | + | :5. Place one piece of plant tissue into each of the 6 [[Boiling Tube|boiling tubes]] leaving them for 12-24 hours (ensuring it is the same time for all). |
| + | | style="height:20px; width:200px; text-align:center;" | | ||
| + | :6. Remove the pieces of plant tissue, drying them with a paper towel and measure their [[mass]]. | ||
|} | |} | ||
:7. Plot a graph showing the concentration of [[sugar]] [[solution]] on the x-axis and the change in [[mass]] of plant tissue on the y-axis. | :7. Plot a graph showing the concentration of [[sugar]] [[solution]] on the x-axis and the change in [[mass]] of plant tissue on the y-axis. | ||
| + | |||
| + | ===References=== | ||
| + | ====Edexcel==== | ||
| + | :[https://www.amazon.co.uk/gp/product/1292120193/ref=as_li_tl?ie=UTF8&camp=1634&creative=6738&creativeASIN=1292120193&linkCode=as2&tag=nrjc-21&linkId=572df39392fb4200db8391d98ae6314e ''Biology core practicals; osmosis in potato slices, pages 22-23, GCSE Combined Science, Pearson Edexcel ''] | ||
Latest revision as of 14:25, 2 November 2019
Contents
Key Stage 4
Meaning
Investigate the effect of the concentration of sugar solution on the mass of plant tissue.
Experiment
Variables
- Independent Variable - The concentration of sugar solution.
- Dependent Variable - The mass of plant tissue at the end.
- Control Variables - Volume of plant tissue. Surface area of plant tissue. Length of time the plant tissue is left in solution. Temperature of the solution.
Method
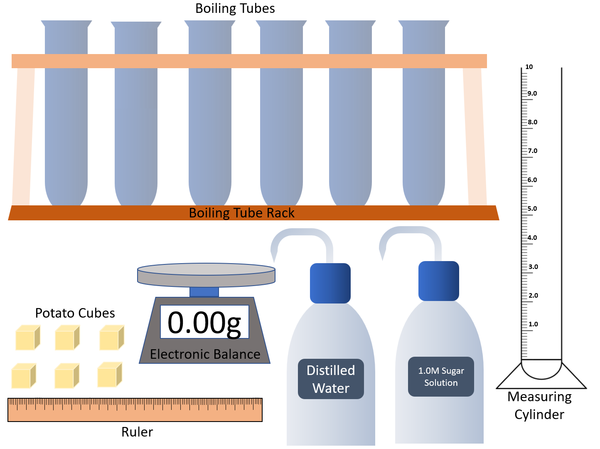
| A diagram of the equipment needed in this experiment. |
|
|
|
- 7. Plot a graph showing the concentration of sugar solution on the x-axis and the change in mass of plant tissue on the y-axis.
